Around the world, many metropolises are taking action important to improve the conditions of the people who they travel by bicycle. Notable success stories come from the acclaimed utopias of Dutch or Danish cycling, where the investment is maximum and, for example, they build a garage underground for 12,000 Bicycles, crazy!.
But this time we would like to give a simple and visual version to through different graphs that provide us with data rather than interesting, whether to break myths or simply to see how they can transform cities.
Content menu:
The more people ride bicycles on the streets, the the safer the streets for everyone who rides bicycle. This phenomenon, originally identified by the researcher Peter Jacobsen, is known as "safety in numbers”. And that's exactly what cities Americans are watching as they add more infrastructure for bike lanes. According to a report from the National Association of City Transportation Officials:

Some people are put off by the apparent dangers of cycling, but only 1% of head injuries they happen to people who ride a bicycle; is much more you're likely to sustain a car injury.
And if you're not convinced, you can always try this recycled paper hull that, in addition to being comfortable and very resistant, folds.
But… What type of infrastructure attracts more people who hesitate to go by bike? The answer is obvious, protected bike lanes!. Among the "interested, but that they are really worried”, 81% comment that the bike lanes that offer some physical protection against car traffic, would make them feel more comfortable and would at least try.

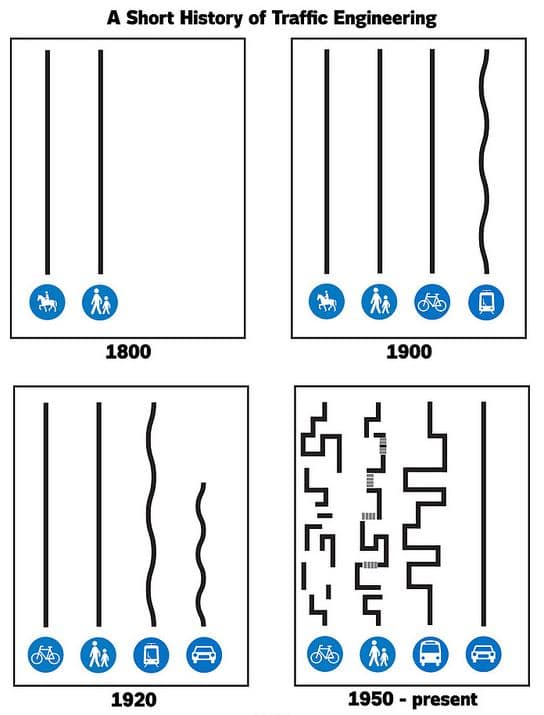
In many cities around the world, cars are still having priority over people on foot, bicycles or public transport. A change of mentality is necessary and the graphical representation to understand what has happened historically it is:
And growth that maximizes the benefits of public transport or sustainable means of transport, while strongly emphasizes its users and people, to this design form translated into Spanish, is called "Transport Oriented Development" (DOT).
Copenhagen is possibly one of the cities with the most cyclists in the world in relation to its population and the graph next confirms it. For that 2016 the number of bicycles entering the city center exceeded the number of cars:

In the city, a section of Hans Boulevard was analyzed Christian Andersen to show how much space was given to the motor vehicles (red), compared to bicycles (blue), pedestrians (yellow) and buses (green). in throughout the city, bicycles represent 62% of the displacements; however, they get 7% of the space . Cars are 9% of the displacements; however, get 54% of the space .

A large number of readers surely think that one of the main reasons why people go to bicycle is related to the environment but, in truth, it represents the last conviction; first because it is faster, in second place is exercising, in third place economic issue and lastly, the environment atmosphere…. So we still have a lot to learn!

If we look at the Bicycle Barometer in Spain 2017 prepared by the DGT and we inquired into those that did not use. Among the main reasons for not using a bicycle highlights not having one or They prefer other means of moving such as the car.

Regarding the previous graph, what would happen if the traffic lights instead of favoring motor vehicles, favor and prioritize the circulation of bicycles.
In the city of Nørrebrogade (Denmark) they established what it was called "the green wave", the traffic lights were changed to favor bicycles, consequently, the flow of traffic is greatly improved by considerably reducing journey times in bikes.

Surely you have heard “Cyclists are just a group of young people who have no money” or "They ride their bikes to a coffee shop, sit there for four hours with their phones and they don't really spend money" or the typical one of... " You are taking away street parking to put bike lanes and a station for these, well now I will have to close the shop «.
Well, Mr. Grocer, according to the graphs, you are going to earn more money at the end of the month.

The first graph shows how much consumers spent on average per trip (according to type of transport), the second, how many trips per month on average and the third, the estimate total consumer spending per month by type of transportation used.
The most interesting thing about the three graphs is that the cyclists make many more trips than vehicles engine and although they possibly spend less in relation to each trip, at the end of the month, the cost is higher. (Can read more from HERE with access to the report)
In most cases, they are a bargain for both taxpayers and users of the city. By a few thousand kilos of paint, a bit of signage and cement, you can get a city friendly to the bicycles, and tens of thousands of smiling cyclists.
In the city of Portland with almost 700,000 users (USA), one of the friendliest and healthiest cities for cyclists in this country, the reconversion and construction of lanes reached a cost of 60 million dollars in the recent years (Report that perfectly details each cost and investment chapter). The same cost as, one mile from the urban highway but not all that glitters is gold.
An article about the city of Seattle reveals that a poor planning in the introduction of the bike lane on the city caused costs to rise to high levels being able to only incorporate half of the lanes planned.

Given this scheme, we remind you that we have an excellent article that talks about an online tool to design routes urban as if it were a game.
The results of a study on the costs and benefits of city cycling have received a lot of attention in the mainstream and social media because they have a story that intuitively seemed wrong.
The report Transport transitions in Copenhagen: Comparing the cost of cars and bicycles shows that both the costs both private and social in driving cars in Copenhagen, are much higher than going by bike, but are not due to reduced pollution or emissions.
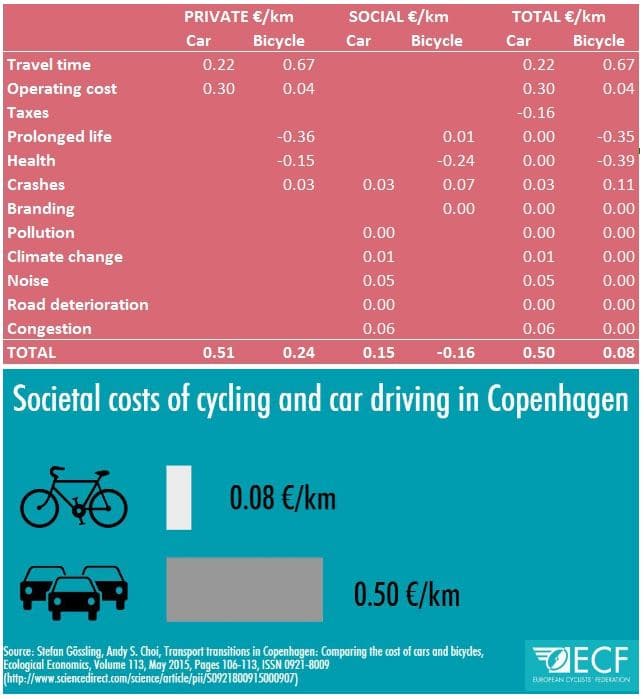
The authors conclude that while each kilometer traveled by car in Copenhagen costs money to the society, each kilometer traveled by bicycle saves money .
This represents a saving of 0.31 euros per kilometer . The explanation, say the researchers, is that the benefit of exercise with bicycles reduces significantly the costs associated with poor health , for example, medical treatment and diseases. These savings are more than three times greater than health costs between possible cyclist crashes.
While drivers are less receptive to provide information about their trips, cyclists are which are the opposite , as long as your data promote the cycling network in your city. There are some applications that with a simple app you can provide information that will help urban planners to better understand the needs of the cyclist.
For example, Strava, a social network for athletes and bike lovers, relaunched its Global Heatmap with more data and better charts. The interactive map shows more than billion trips made by millions of members from Strava.

The map provides a fairly direct sense of the busiest traffic corridors, but it's just the face public of a large amount of data about how the pedestrians and cyclists.
And if you are interested in the subject, we have an article on how to implement a bicycle system in the city, corresponds to an analysis of a strategic plan designed by a Spanish architect and the article on the bicycle of wood.
If you liked the article, rate it and share!